If you’re new to stock trading or investing, you’ve probably come across terms like RSI, MACD, and Moving Averages. They might seem intimidating at first, but don’t worry—these are just tools that help traders understand price movements. In this guide, we’ll break them down in the simplest way possible, so even if you’ve never used technical indicators before, you’ll leave with a clear understanding.
Why Should Beginners Learn Technical Indicators?
Before we jump into the indicators themselves, here’s a quick reason why learning them is important.
When you invest in stocks, it helps to know when to buy and when to sell. Fundamental analysis tells you what to buy based on company performance. But technical analysis tells you when to buy or sell, based on price trends and patterns.
That’s where RSI, MACD, and Moving Averages come into play.
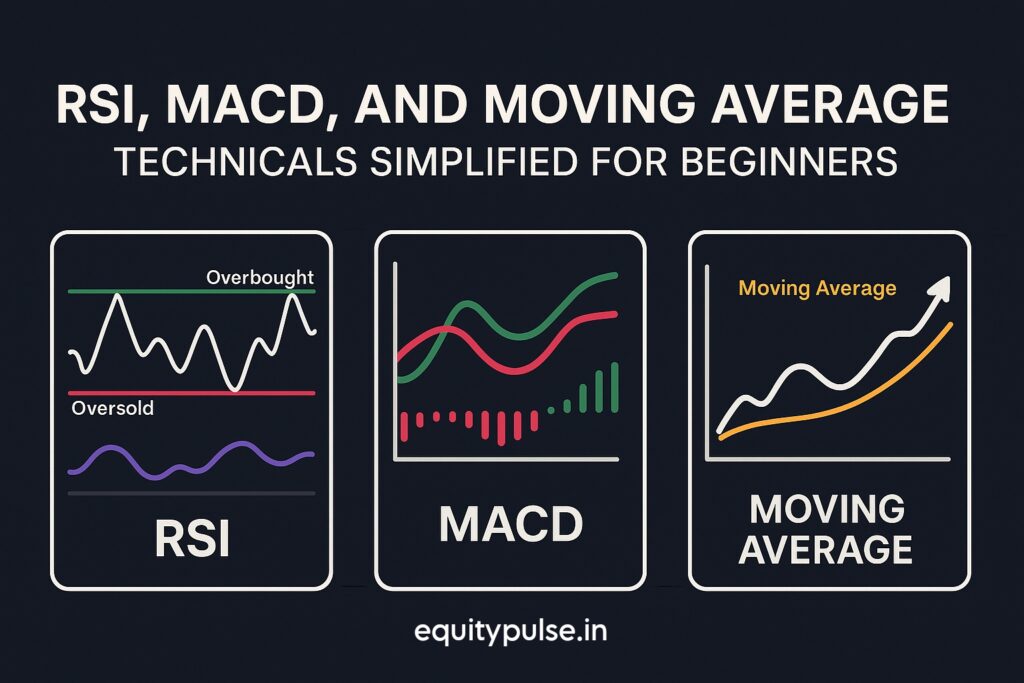
What is RSI (Relative Strength Index)?
RSI stands for Relative Strength Index. It’s a momentum indicator that tells you whether a stock is overbought or oversold.
- Range: RSI moves between 0 and 100.
- Key levels:
- Above 70 = Overbought (might be due for a correction)
- Below 30 = Oversold (could be a buying opportunity)
✅ Example:
If a stock’s RSI is 82, it means the stock has been rising sharply and may cool off soon. If it’s at 22, it might be undervalued in the short term.
What is MACD (Moving Average Convergence Divergence)?
MACD is a bit more advanced but super powerful. It shows the relationship between two moving averages of a stock’s price.
- MACD Line: 12-day EMA – 26-day EMA
- Signal Line: 9-day EMA of the MACD line
- Histogram: The difference between MACD and Signal line
🚨 How to use MACD:
- When the MACD Line crosses above the Signal Line, it’s a bullish signal (good time to buy).
- When it crosses below, it’s a bearish signal (might be time to sell).
✅ Example:
If you’re watching a stock and the MACD gives a bullish crossover, many traders see this as a green light to buy.
What is a Moving Average?
Moving Averages smooth out price data to show the average value over a specific period.
There are two types:
- SMA (Simple Moving Average) – Basic average over a set number of days.
- EMA (Exponential Moving Average) – Gives more weight to recent prices.
📈 Common periods:
- 20-day: Short-term trend
- 50-day: Medium-term trend
- 200-day: Long-term trend
✅ Example:
If a stock is trading above its 200-day moving average, it’s generally considered to be in a long-term uptrend.
How Can Beginners Use These Indicators Together?
Smart traders often combine these indicators to avoid false signals.
📊 A Simple Strategy:
- Check if RSI is near 30 (oversold)
- Look for a MACD bullish crossover
- See if the price is above the 50-day EMA
If all signs align, it could be a good entry point. But always remember: No indicator is 100% accurate. Use them with proper risk management.
Common Mistakes to Avoid
❌ Blindly following indicators without checking the market context
❌ Using too many indicators at once (leading to confusion)
❌ Ignoring fundamentals completely
Final Thoughts
Technical indicators like RSI, MACD, and Moving Averages are not magic formulas—they’re tools to help you make more informed decisions. As a beginner, focus on understanding the basics and practice with historical charts before applying them in real trades.
